The 'Parsable Project' was a fascinating and complex undertaking during my internship. The
project's main objective was to monitor the data recorded from BIG factories using IoT devices,
ensuring the proper functioning and accuracy of the data collected. As a Data Analyst intern, I
played a vital role in retrieving and analyzing the IoT data to enable real-time monitoring and
decision-making.
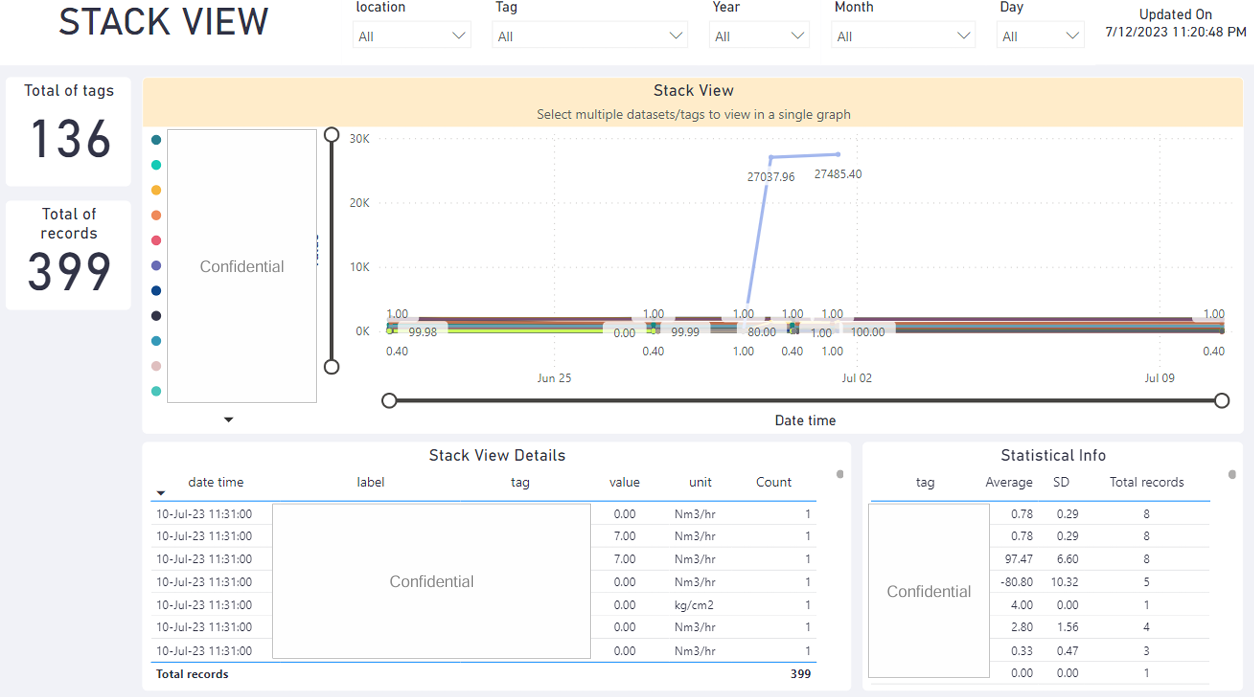
To begin the project, I retrieved the data from the SQL server, following the standard data
retrieval process. Since BIG has numerous factories located throughout Thailand, I recognized
the need for enhanced data accessibility. To achieve this, I incorporated user-friendly filters
in
the dashboard, enabling users to select specific factory locations and datasets they wanted to
monitor.
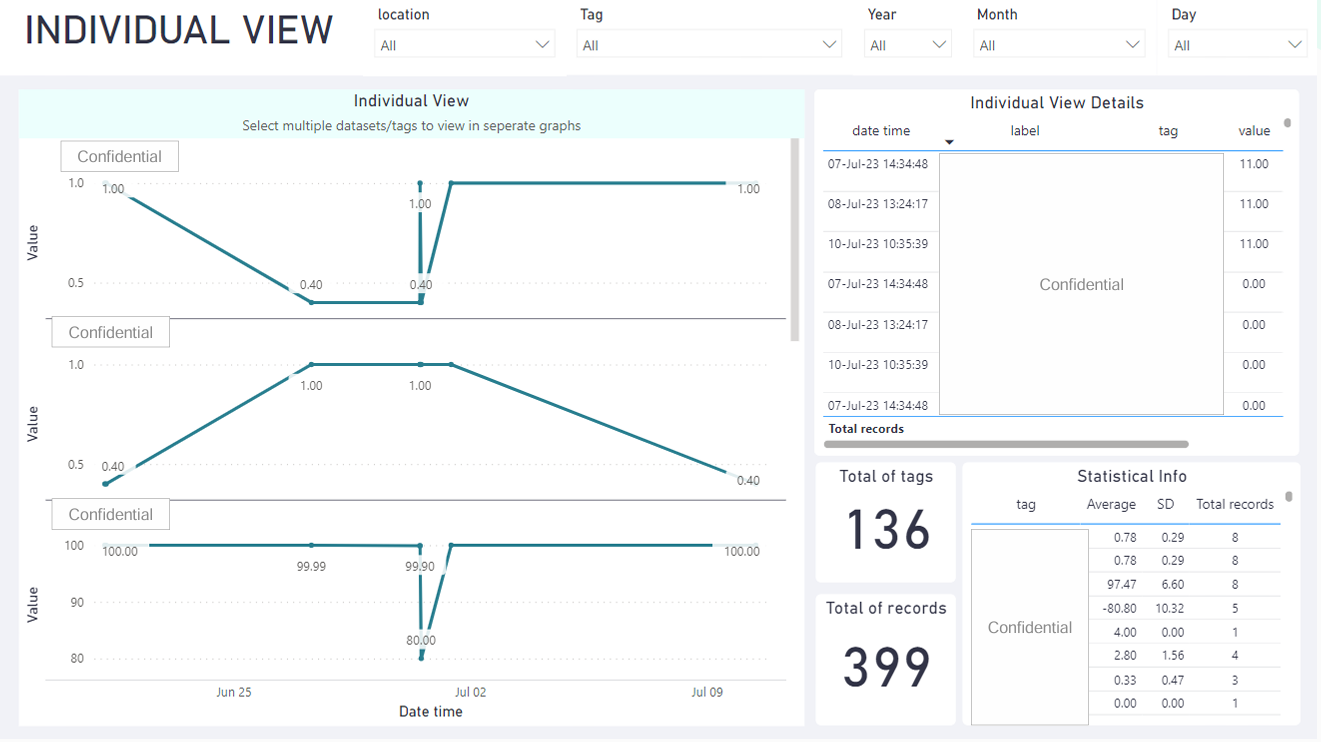
The dashboard's interface allowed users to visualize the IoT data through interactive line
graphs and tables. The line graphs displayed trends and patterns over time, offering insights
into the
performance of various IoT devices and factory processes. The tables provided a detailed
breakdown of the data, facilitating deeper analysis and comparisons between datasets.
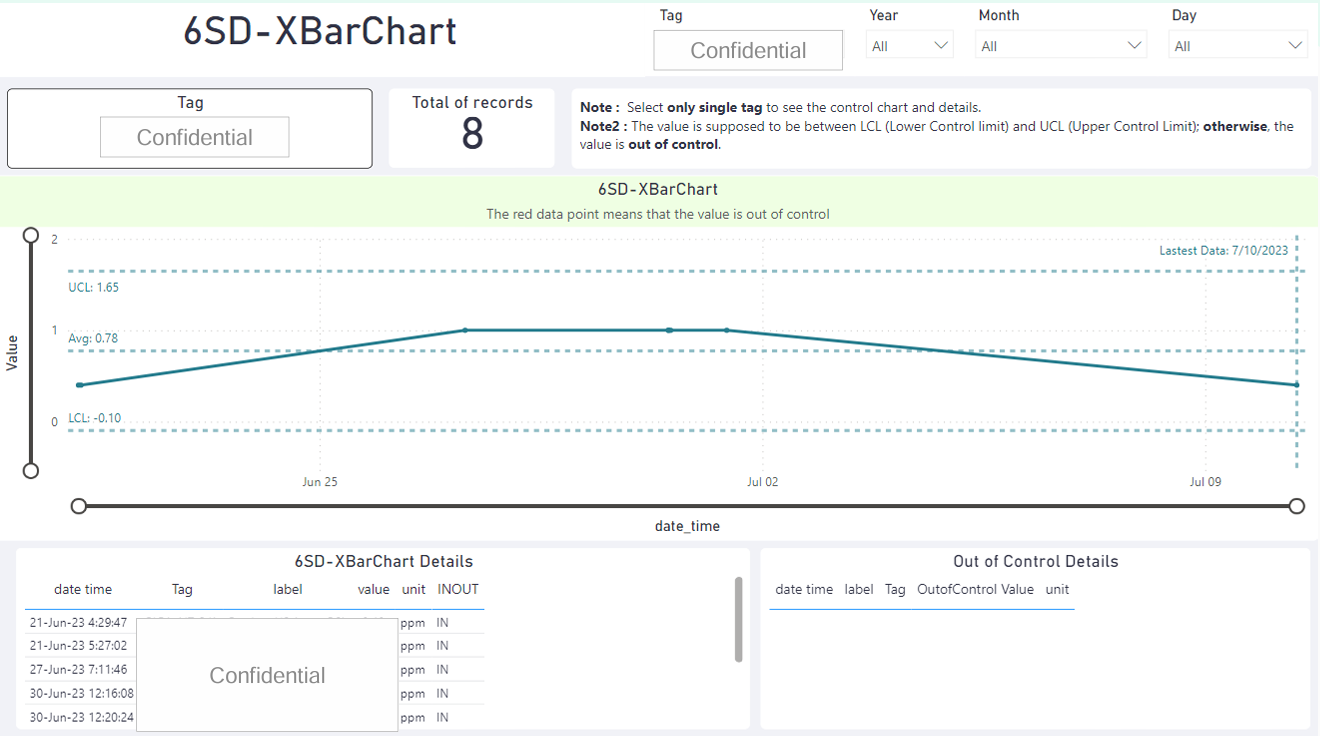
To ensure data quality and identify anomalies, I implemented an X-bar control chart. This
statistical tool allowed users to detect whether the IoT data fell outside the expected range,
indicating potential issues or malfunctions in the factory processes. Additionally, I created a
separate table to store only the out-of-range data for further investigation and swift action.
The 'Parsable Project' posed unique challenges due to the diverse datasets from various factories
and the need for real-time monitoring. The dashboard's design required thoughtful consideration
to
accommodate different user preferences and data visualization requirements. The successful
completion of the 'Parsable Project' not only contributed to the efficient monitoring of BIG
factories but
also demonstrated the significance of IoT data analysis in maintaining optimal production
processes.